Support, Resistance, Indicators & Charts Explained Simply For Beginners.
If you want to succeed in Forex trading, you must understand one powerful skill:
How to read price charts.
This skill is called technical analysis.
Technical analysis helps traders study past price movements to identify patterns and potential future price direction. It focuses on charts, price behavior, and indicators, not news.
Let’s break it down step-by-step.
1️⃣ Understanding Forex Charts


4
There are three main chart types:
1. Line Chart
- Simple and clean
- Shows closing prices only
- Best for spotting overall trend
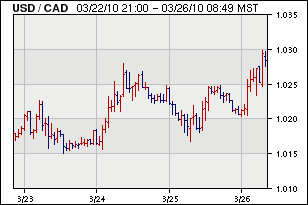
2. Bar Chart
- Shows Open, High, Low, Close (OHLC)
- More detailed
3. Candlestick Chart (Most Popular)
- Shows OHLC clearly
- Easy to see market sentiment
- Green/white candles = bullish (buyers strong)
- Red/black candles = bearish (sellers strong)
Most traders use candlestick charts because they visually show who controls the market.
2️⃣ Support and Resistance (The Foundation)


4
Support and resistance are the most important concepts in technical analysis.
🔹 Support
A price level where the market stops falling and bounces upward.
Think of it as a floor.
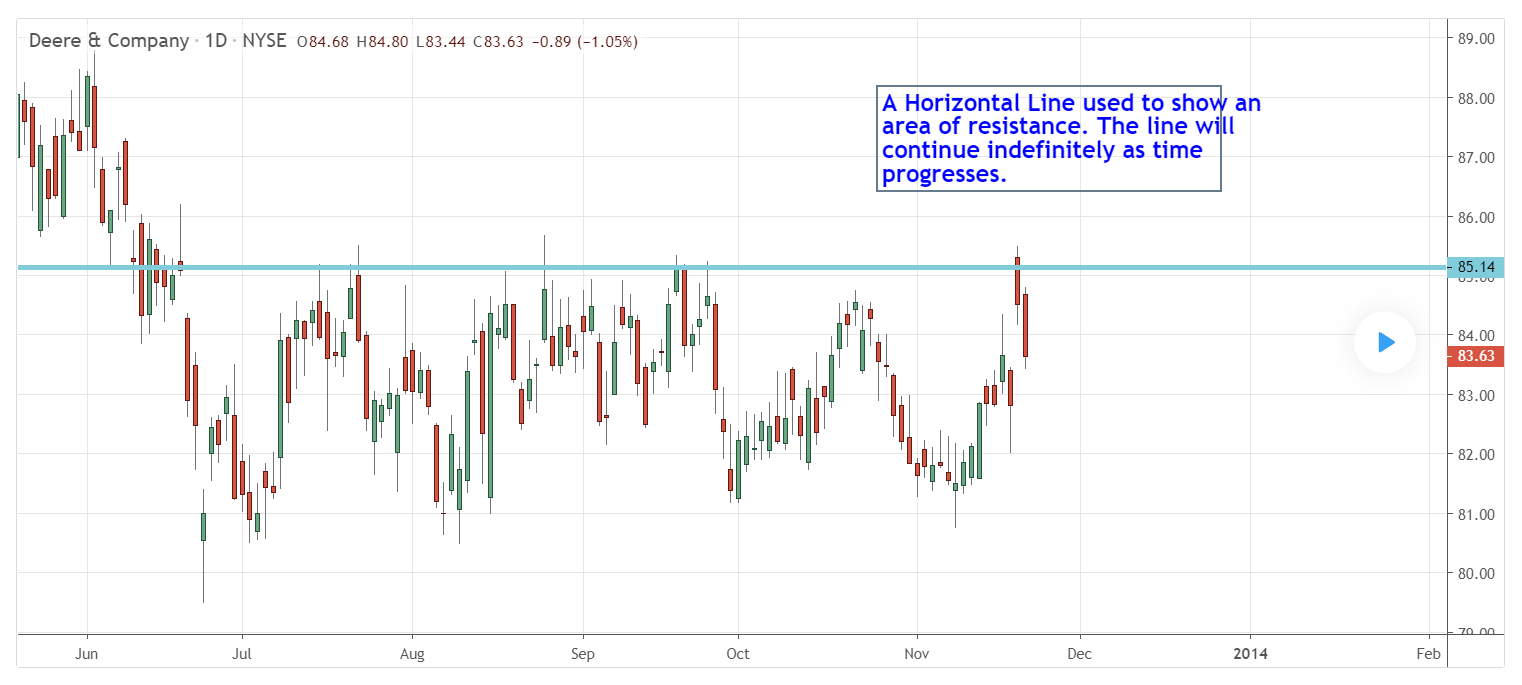
🔹 Resistance
A price level where the market stops rising and falls downward.
Think of it as a ceiling.
Real-Life Example
If EUR/USD keeps bouncing around 1.0800 multiple times, that level becomes support.
If price repeatedly fails near 1.1000, that becomes resistance.
Traders use these levels to:
- Enter trades
- Set stop-loss
- Set take-profit
3️⃣ Understanding Market Trends
Before placing any trade, ask:
Is the market going up, down, or sideways?
🔹 Uptrend
- Higher highs
- Higher lows
🔹 Downtrend
- Lower highs
- Lower lows
🔹 Sideways (Range)
- Price moves between support and resistance
Beginner rule: Trade with the trend, not against it.
4️⃣ Technical Indicators (Tools That Assist You)

4
Indicators help confirm what price is already doing.
But remember:
Indicators assist, they do not predict.
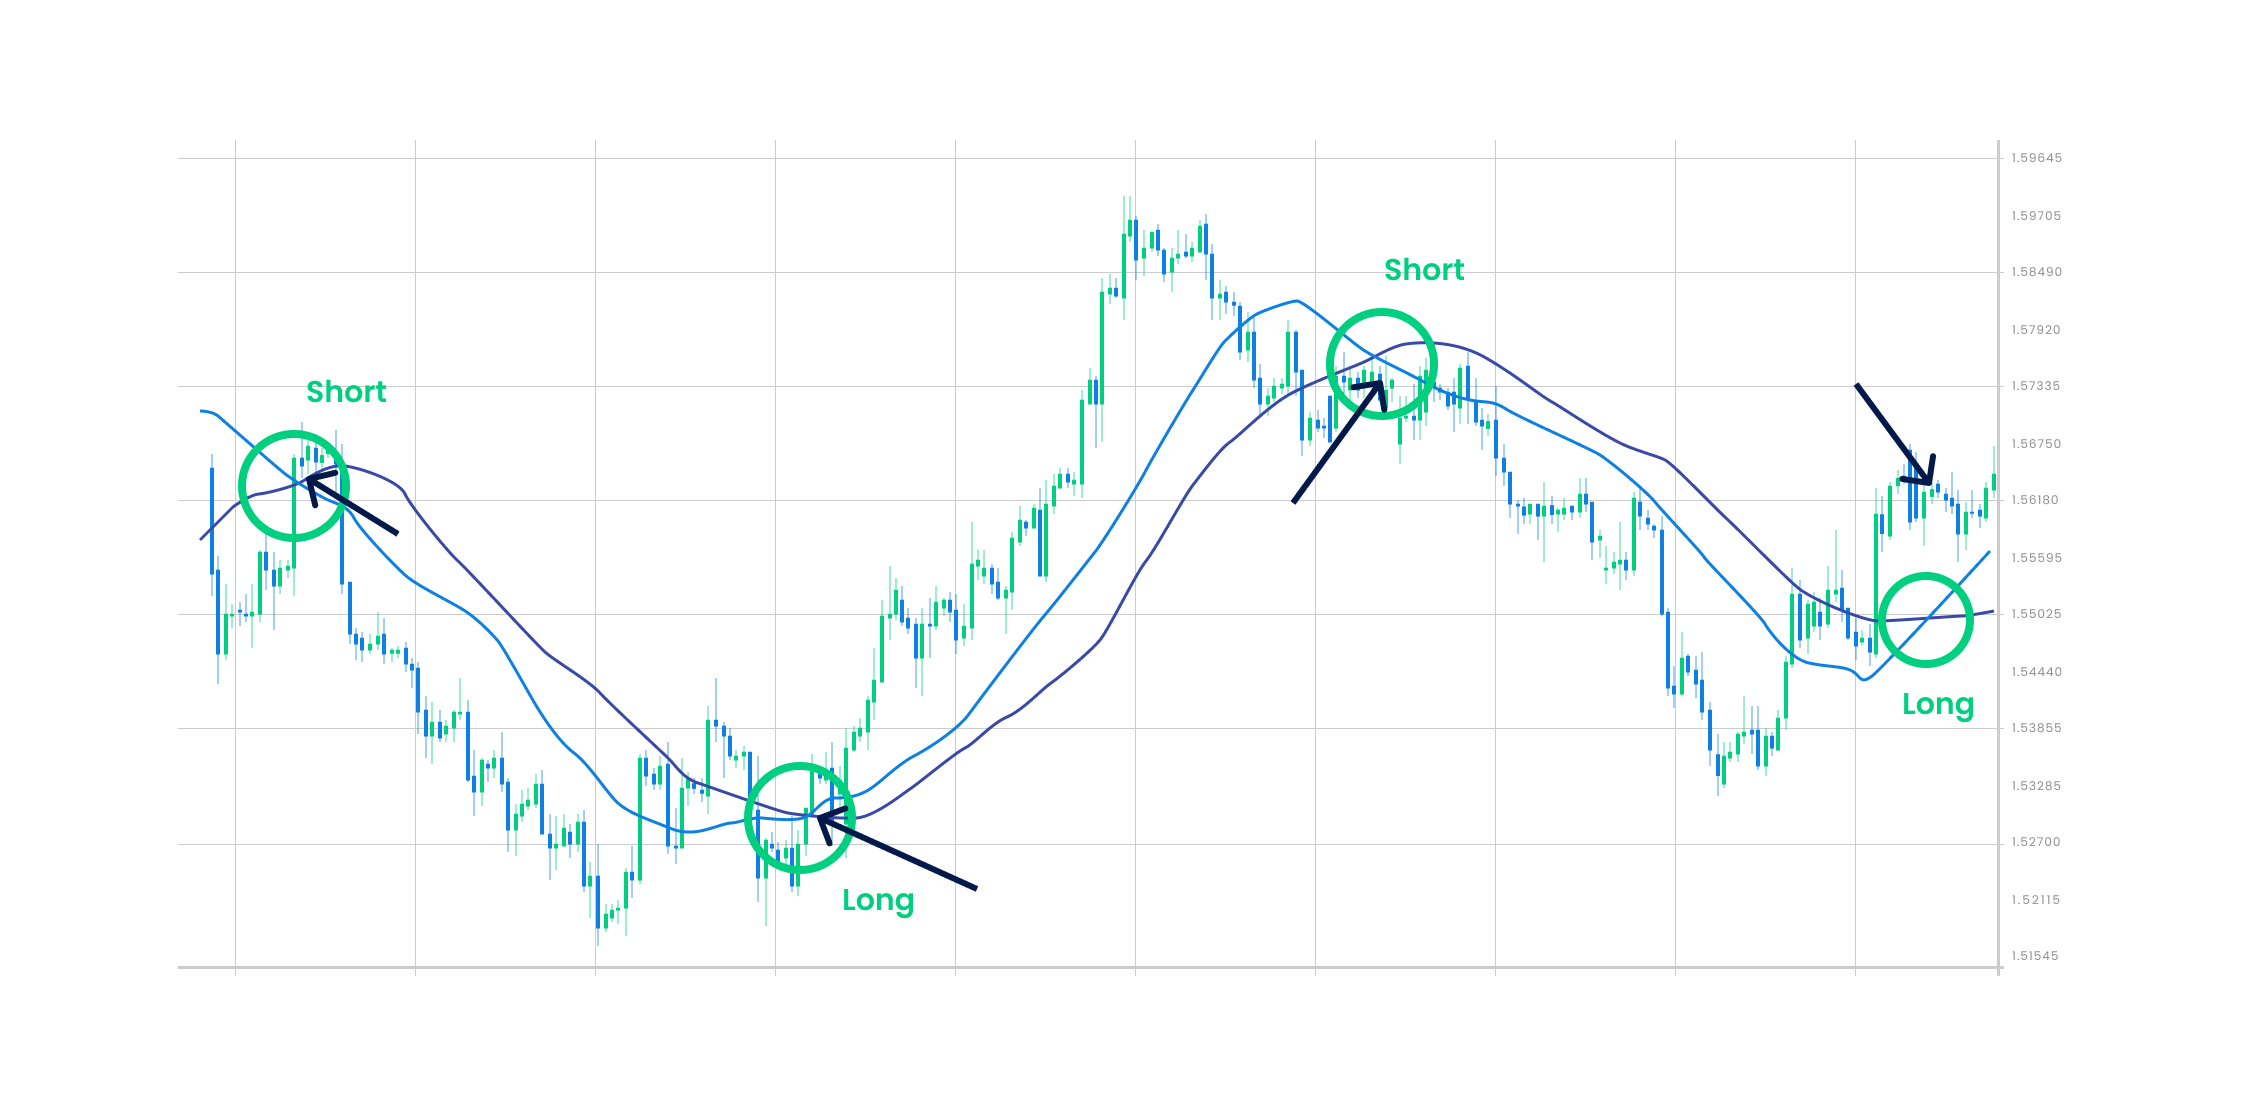
🔹 Moving Average (MA)
Shows the average price over a period.
Uses:
- Identify trend direction
- Spot potential entries
If price is above MA → Uptrend
If below → Downtrend
🔹 RSI (Relative Strength Index)
Measures overbought and oversold conditions.
- Above 70 → Overbought (possible reversal down)
- Below 30 → Oversold (possible reversal up)
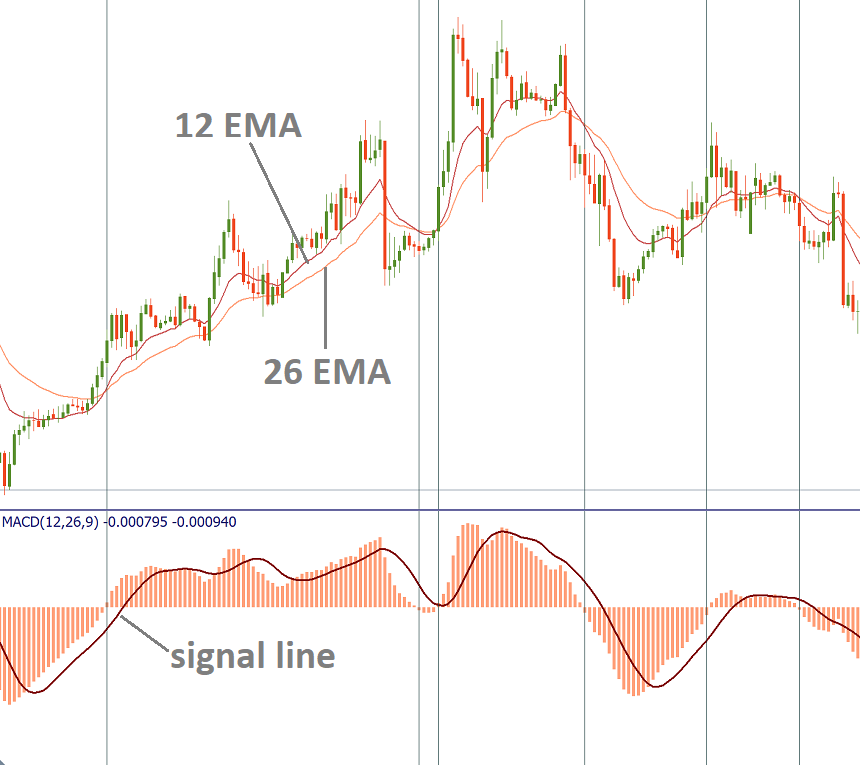
🔹 MACD
Shows momentum and trend changes.
Often used to confirm entries and exits.
5️⃣ Simple Beginner Strategy
If you’re just starting:
- Identify the trend
- Mark support and resistance
- Wait for price to react at key levels
- Confirm with one indicator (not many)
- Use stop-loss
Keep it simple.
Many beginners fail because they:
- Use too many indicators
- Trade without a plan
- Ignore risk management
6️⃣ Practical Example
Imagine GBP/USD is in an uptrend.
- Price pulls back to a strong support level
- RSI drops near 30 (oversold)
- A bullish candlestick forms
That’s a high-probability setup.
You enter with:
- Stop-loss below support
- Take-profit at next resistance
That’s structured trading.
7️⃣ Common Beginner Mistakes
❌ Trading without marking levels
❌ Ignoring trend direction
❌ Using 5–6 indicators at once
❌ Trading on emotion
❌ No stop-loss
Technical analysis works best with:
- Patience
- Discipline
- Risk management
Final Takeaway
Technical analysis is not about guessing.
It’s about:
✔ Reading price
✔ Identifying probability
✔ Managing risk
Master:
- Charts
- Support and resistance
- Trend
- One or two indicators
And you’ll build a strong Forex foundation.
Disclaimer: This article is for educational purposes only and does not constitute financial advice.
